MSP360 Products
How to Monitor Computer Performance with MSP360 RMM
Problems with even one computer can lead to data loss and lost business opportunities. That is why it’s crucial to constantly monitor the state of your IT environment – when you check how your computers perform, you ensure your system is safe and works efficiently.
Monitoring computers’ performance can be a hard task but with RMM solutions (remote monitoring and management) you can easily keep track of your IT environment to find potential issues before they cause significant problems.
In this article, we overview how MSP360 RMM can help MSPs and IT professionals to monitor the whole IT system remotely from one panel to keep them up to date and prevent possible system damage before it occurs.
MSP360 RMM Monitoring Mode
With MSP360 RMM, you can monitor a lot of parameters, such as CPU usage and temperature, memory usage, available updates, antivirus status, event logs, and others. Each parameter can be opened in detailed mode if an issue is found.
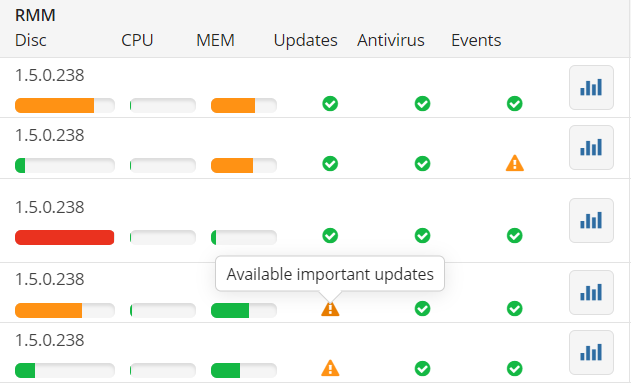
To see all the parameters available for monitoring, click on the diagram icon in the RMM section, and slide-in will open.

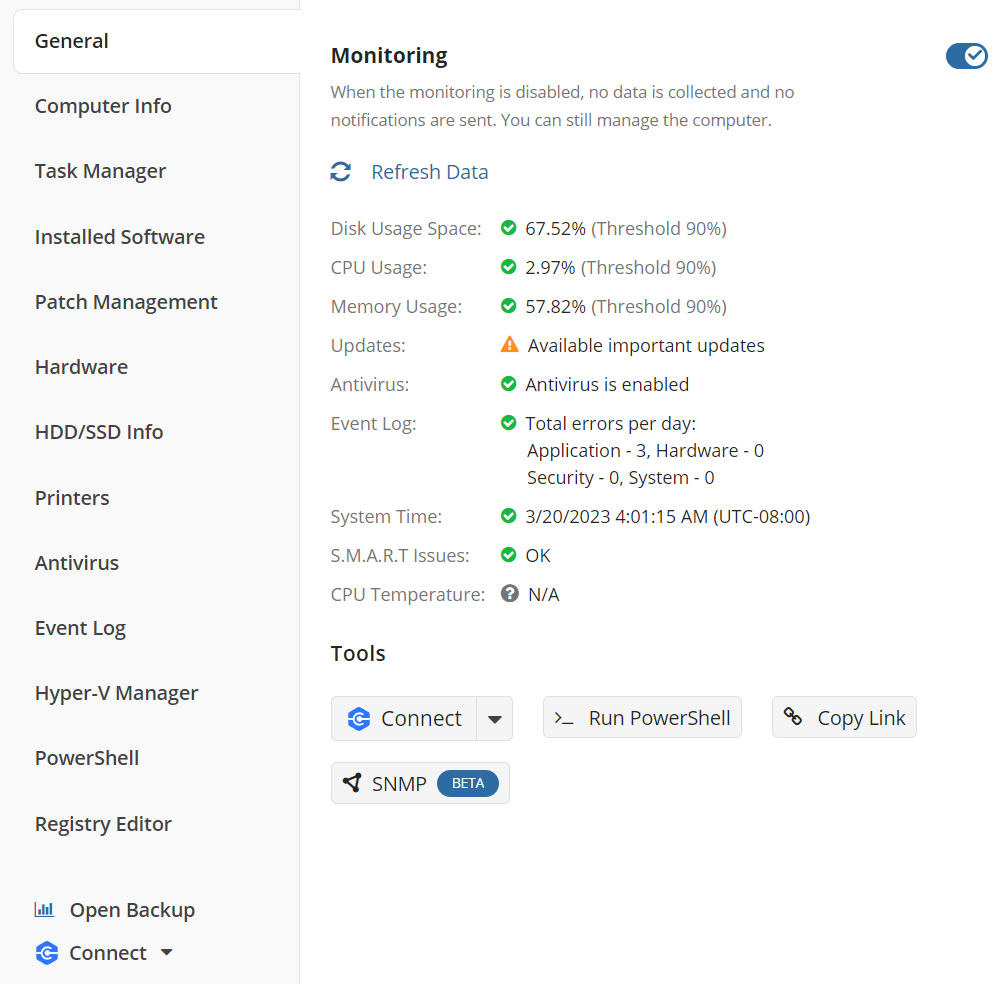
Available parameters:
- General information
- Computer info
- Task manager
- Installed software
- Patch management
- Hardware
- HDD/SSD info
- Printers
- Antivirus
- Event log
- Hyper-V manager
- PowerShell
- Registry editor
Further reading Getting Started with MSP360 RMM
Reasons for Monitoring
Let’s get a closer look at some of the tabs mentioned above and see how you can use RMM to solve your daily tasks and protect your business.
Ensure Your Computers Are Secure
It’s a well-known fact that computer security is the main thing you should care about. You can keep track of your computer security using just three tabs in monitoring mode: Patch management, Antivirus and Event log.
Patch management – install OS updates on target machines to remediate security vulnerabilities. Patches are mostly issued for bug fixes and security improvements to reduce the likelihood of cyberattacks.
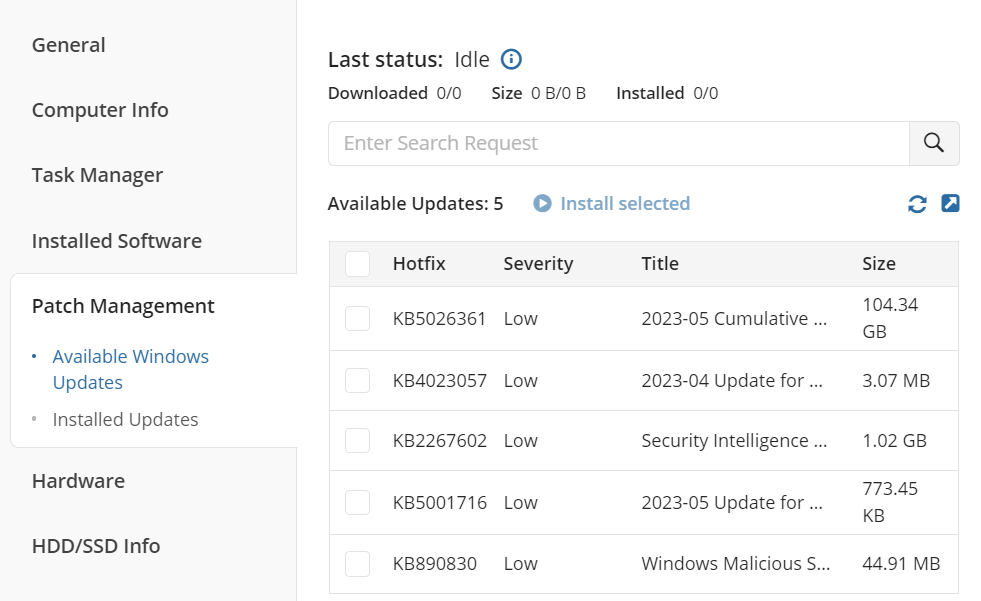
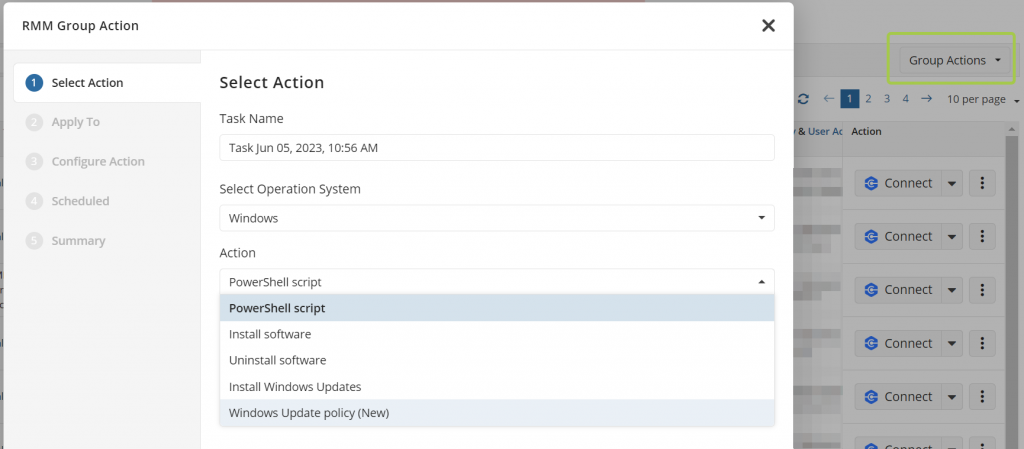
You can scan the operating system on a group of computers to identify available updates and install them in bulk via the RMM Group Actions wizard.
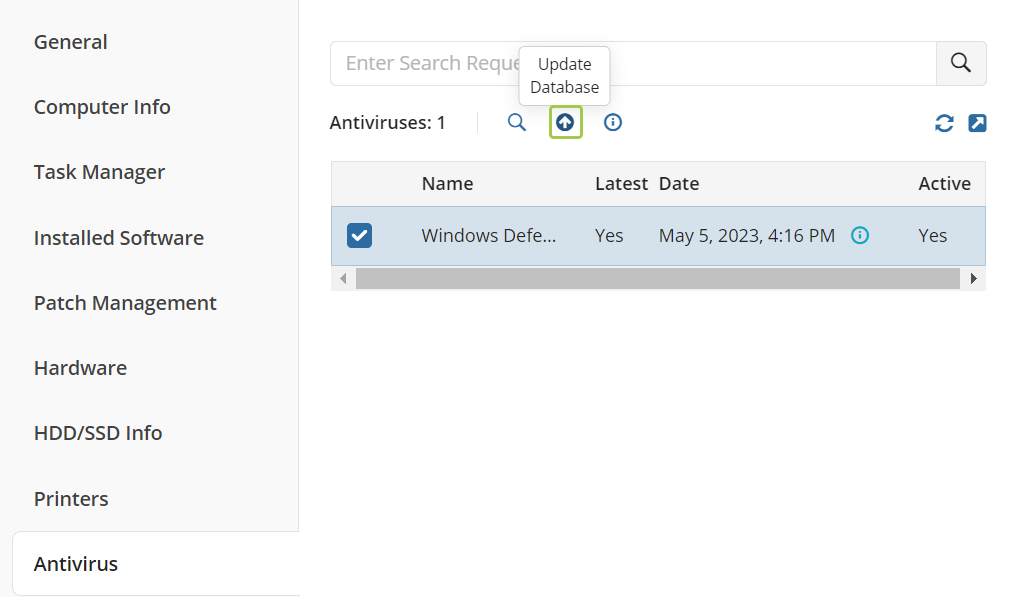
Antivirus – use this tab to check the status of your antivirus and update its databases with up-to-date information about known threats.
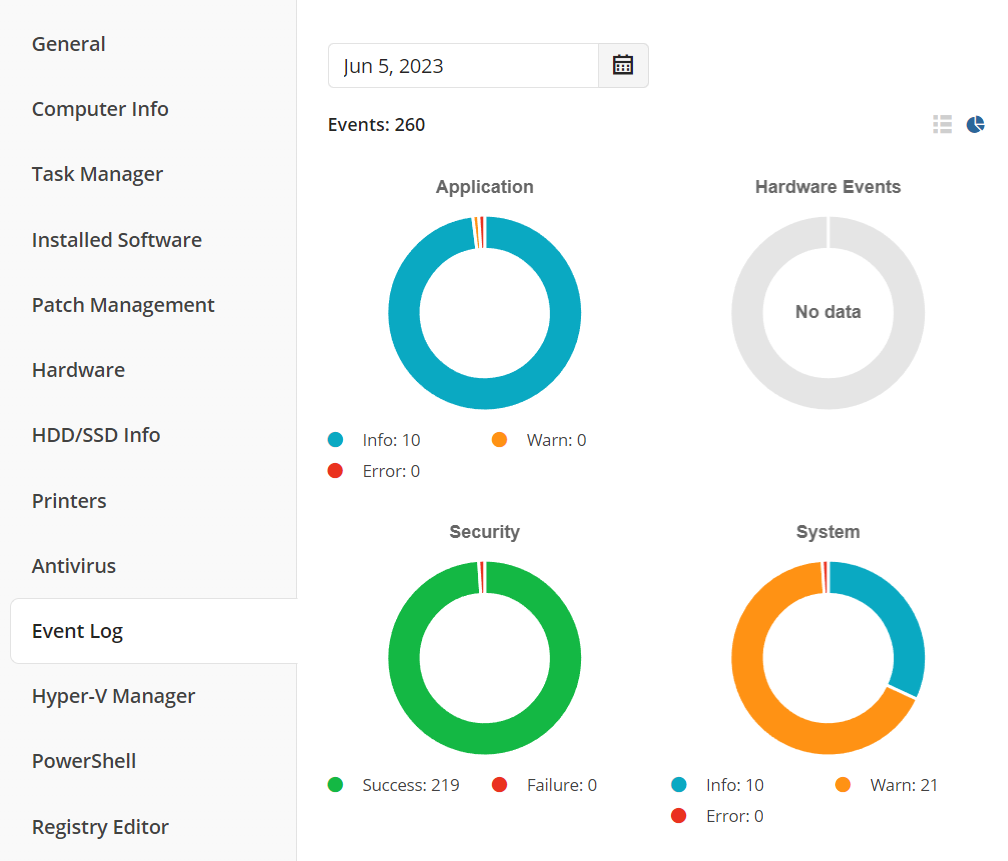
Event log – if a security (or other) issue is detected, a warning will be shown the same day. This way, you get immediate insight into system conditions and possible problems and have time to take action.
Check Computer Performance and Health
Checking the performance of a computer is never superfluous. The more attention you pay to your computer's processes, the less likely you are to miss a signal of a problem or even negative trends that can lead to detrimental consequences. If you track computer performance on a regular basis, you can be sure that a computer is working as expected.
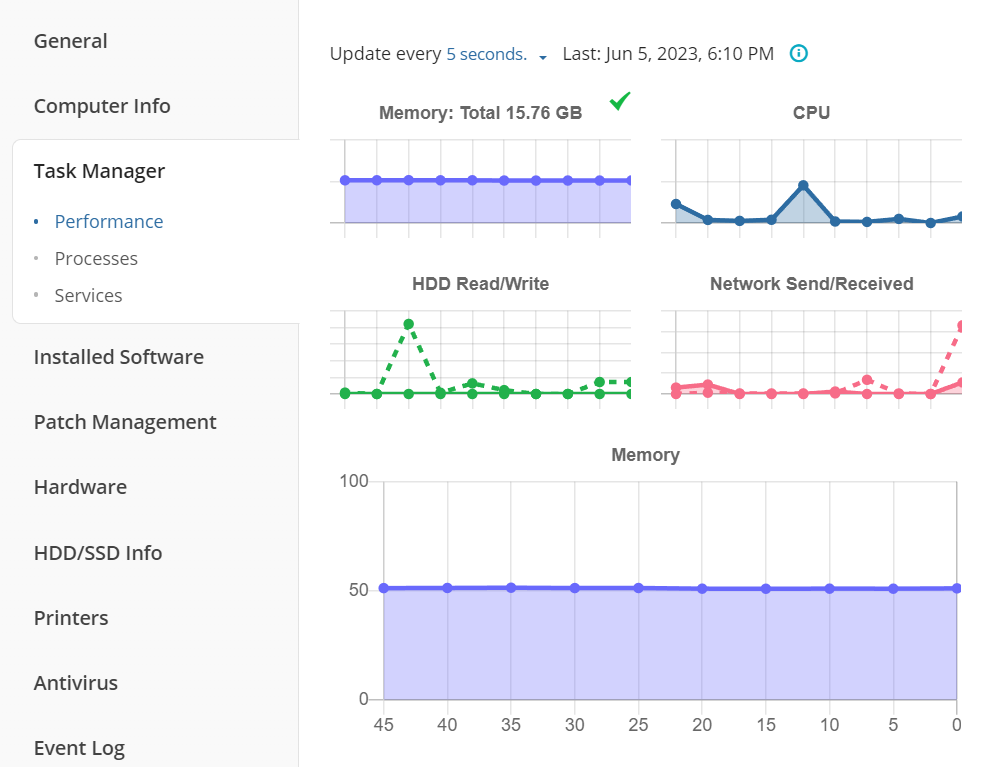
The Task Manager and Event log tabs allow you to monitor the computer’s performance, processes and event statistics in real time.

Minimize Downtime
Various malware, computer bugs and cyberattacks can bring any business to a halt. RMM solutions minimize the possibility of computer issues and protect businesses from downtime as a result. A regular check of all the parameters in the MSP360 RMM panel gives a significant advantage – it will minimize the risks and potential downtime.
MSP360 Alerting for Tracking Computer Performance
We’ve already explained why constant checking is one of the key steps to your computer's health and security. Needless to say, there is not always enough time to check every parameter of every computer, especially if you manage more than ten. For this reason, we created interface alerts which are shown when target machines behave unexpectedly.
How Alerts Are Generated
Alerts reflect the current state of a parameter. They are generated in the following way: the system compares the information just received with the information received 10 minutes ago, and updates the current state of a parameter if there were any changes.
Keep in mind that, if there is no data for the previous period, a comparison is impossible. Also, if the state hasn’t changed compared to the previous 10-minute period, an alert will not be generated either.
Let’s get a closer look at the available parameters and the meaning of each state:
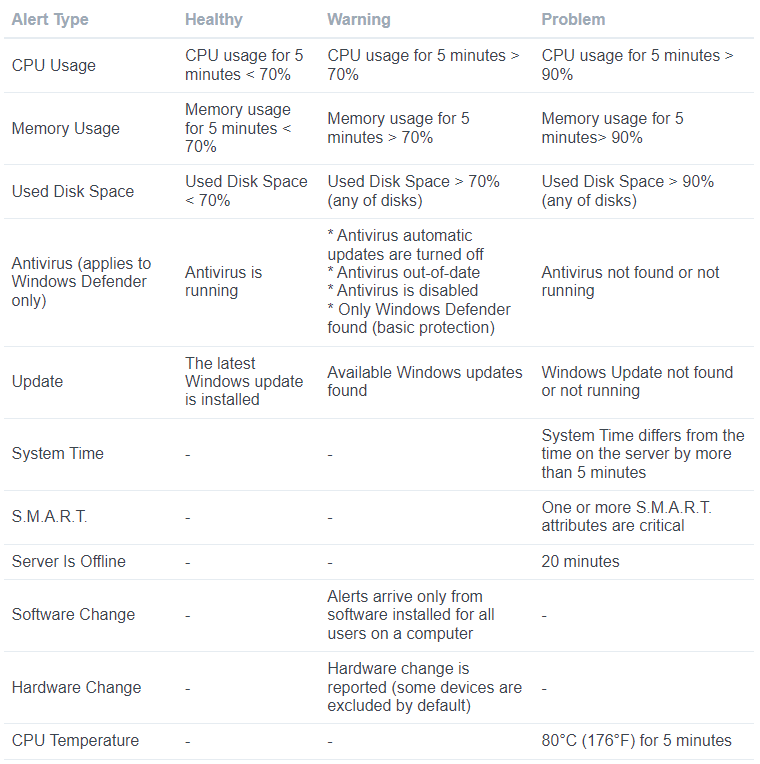
Where you can check computer performance:
1. Home page in the web console;
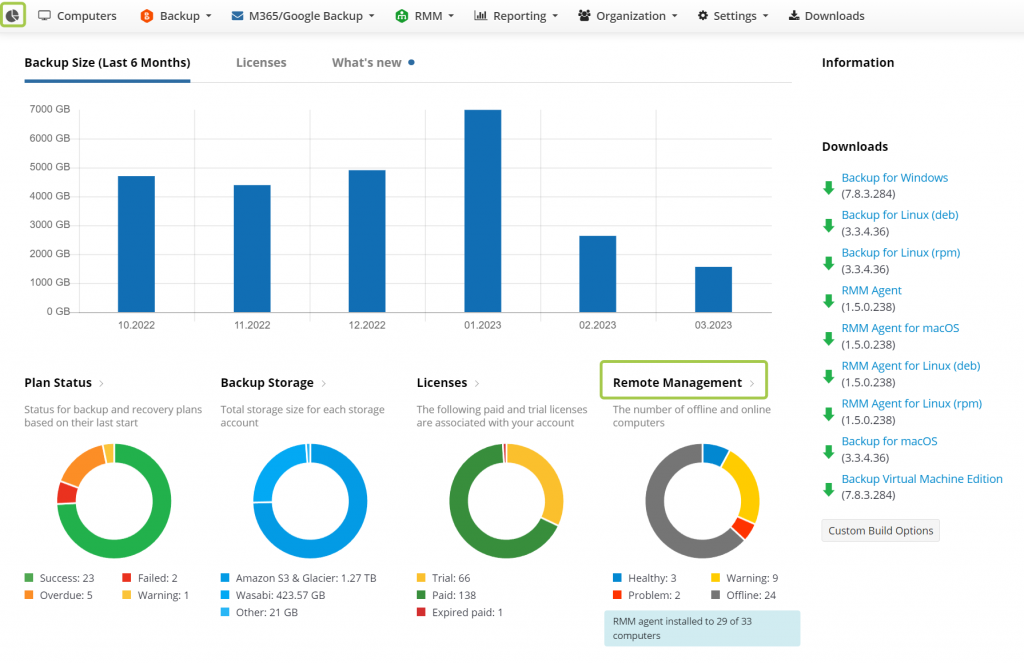
2. RMM Computers tab:

Using alerts, you will always be aware of how your computers are performing and will notice any recurring issues.
Moreover, all alerts are saved on the RMM Alerts History page, RMM tab.
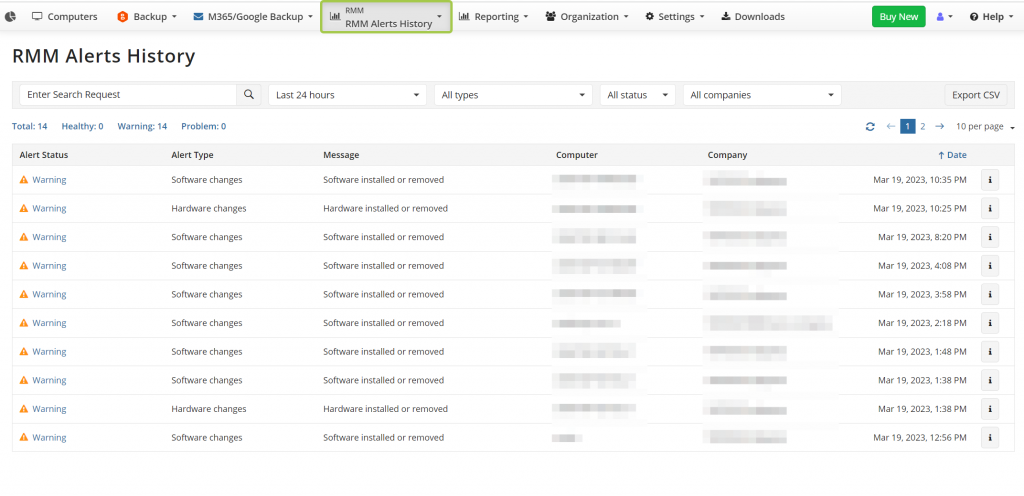
How to Set Up Email Notifications
You can also set up email notifications on the required parameters in order to be notified if something went wrong. This feature is a great advantage for those who want to address issues immediately.
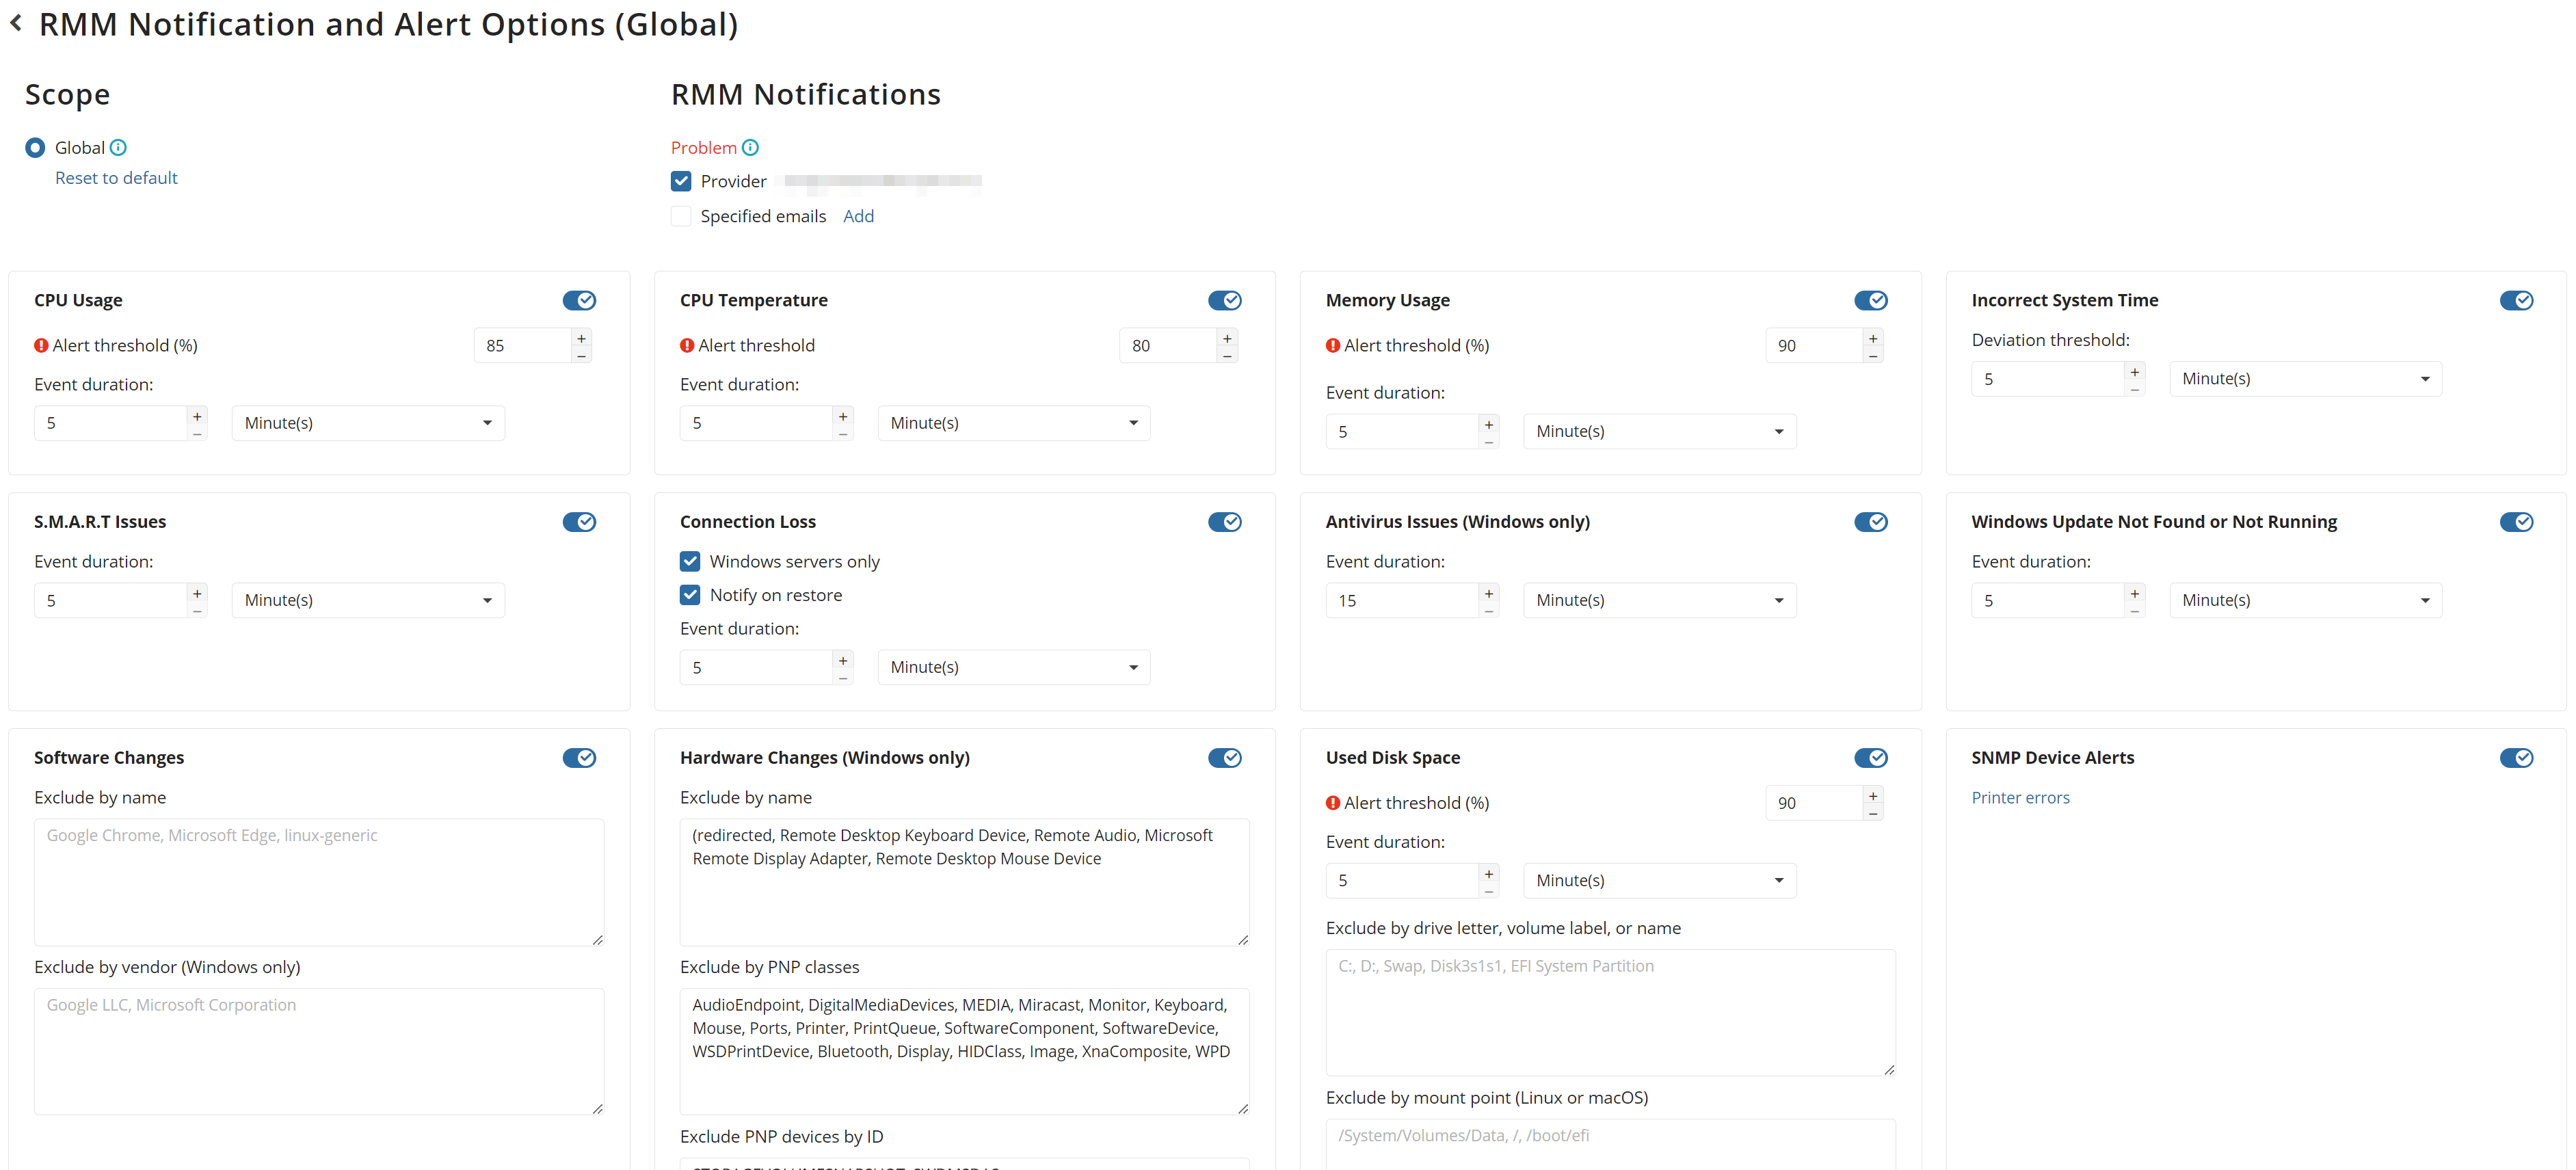
In order to set up email notifications, go to the Settings tab, Notifications. The MSP360 RMM service features the following alert types: CPU and memory usage, used disk space, Windows updates, antivirus issues, incorrect system time, lost connection with server, S.M.A.R.T issues, CPU critical temperature and software/hardware changes.
Not all notifications are available for macOS and Linux devices; some are only available for Windows users.
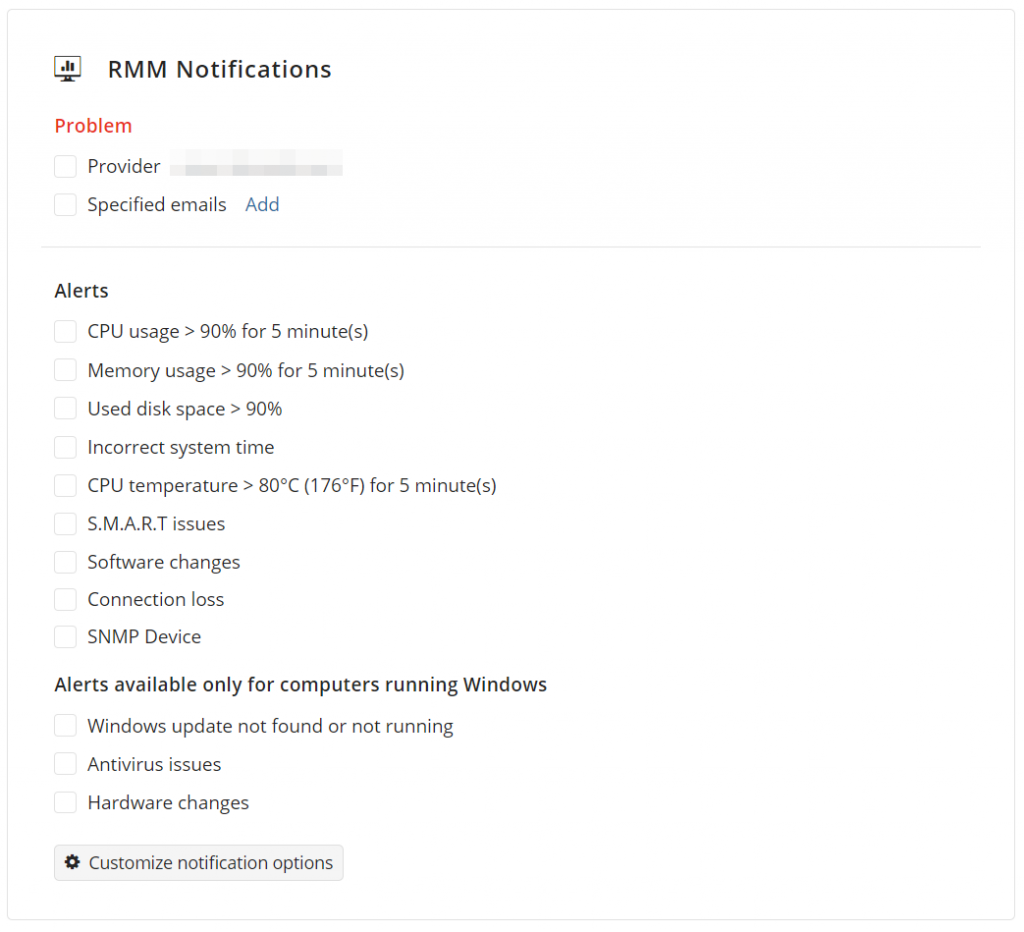
When you click on the "Customize notification option" button, you will be directed to a page where you can personalize your notification settings and set customized alerts.
Scheduled Reports
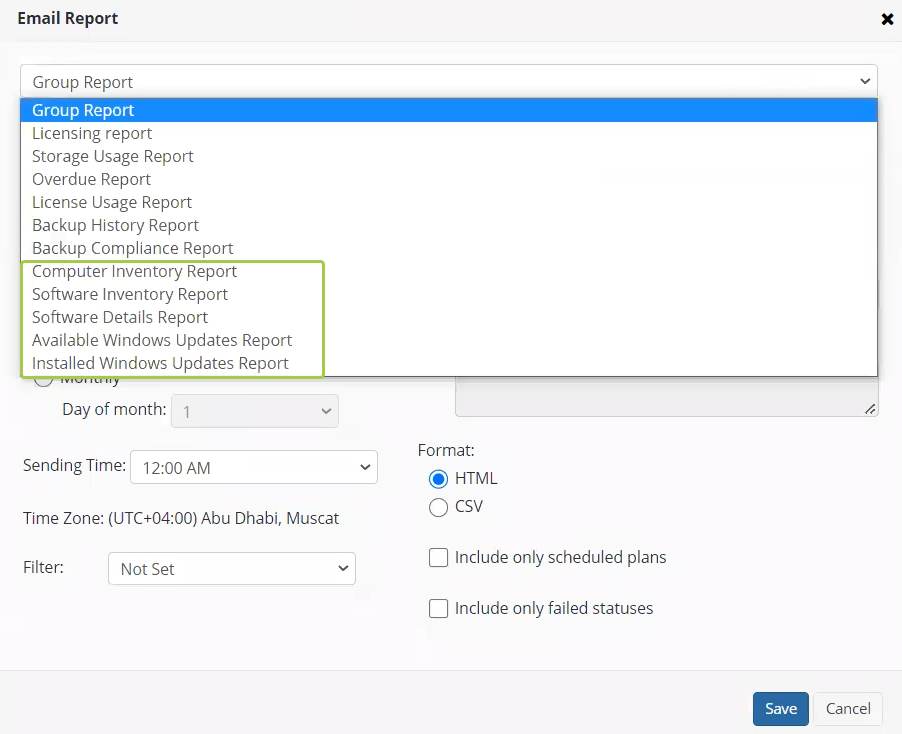
Scheduled reports allow you to configure and schedule automated reports to distribute to specified email addresses. Each report can be exported in CSV format as well. Currently, the following reports are available:
- Software inventory report - get more insights about all the software installed on the endpoints in either HTML or CSV format.
- Computer inventory report - collect data about the devices of the selected company in HTML and CSV formats for further processing. It provides such information as platform type, computer manufacturer, processor and memory information, operating system, language settings, and time zone.
- Software details report - get a detailed list of the software installed on the devices of the selected company.
- Available/installed Windows updates report - in the latest release, we've added two new reports that provide information about both available and installed Windows updates.
SNMP Monitoring
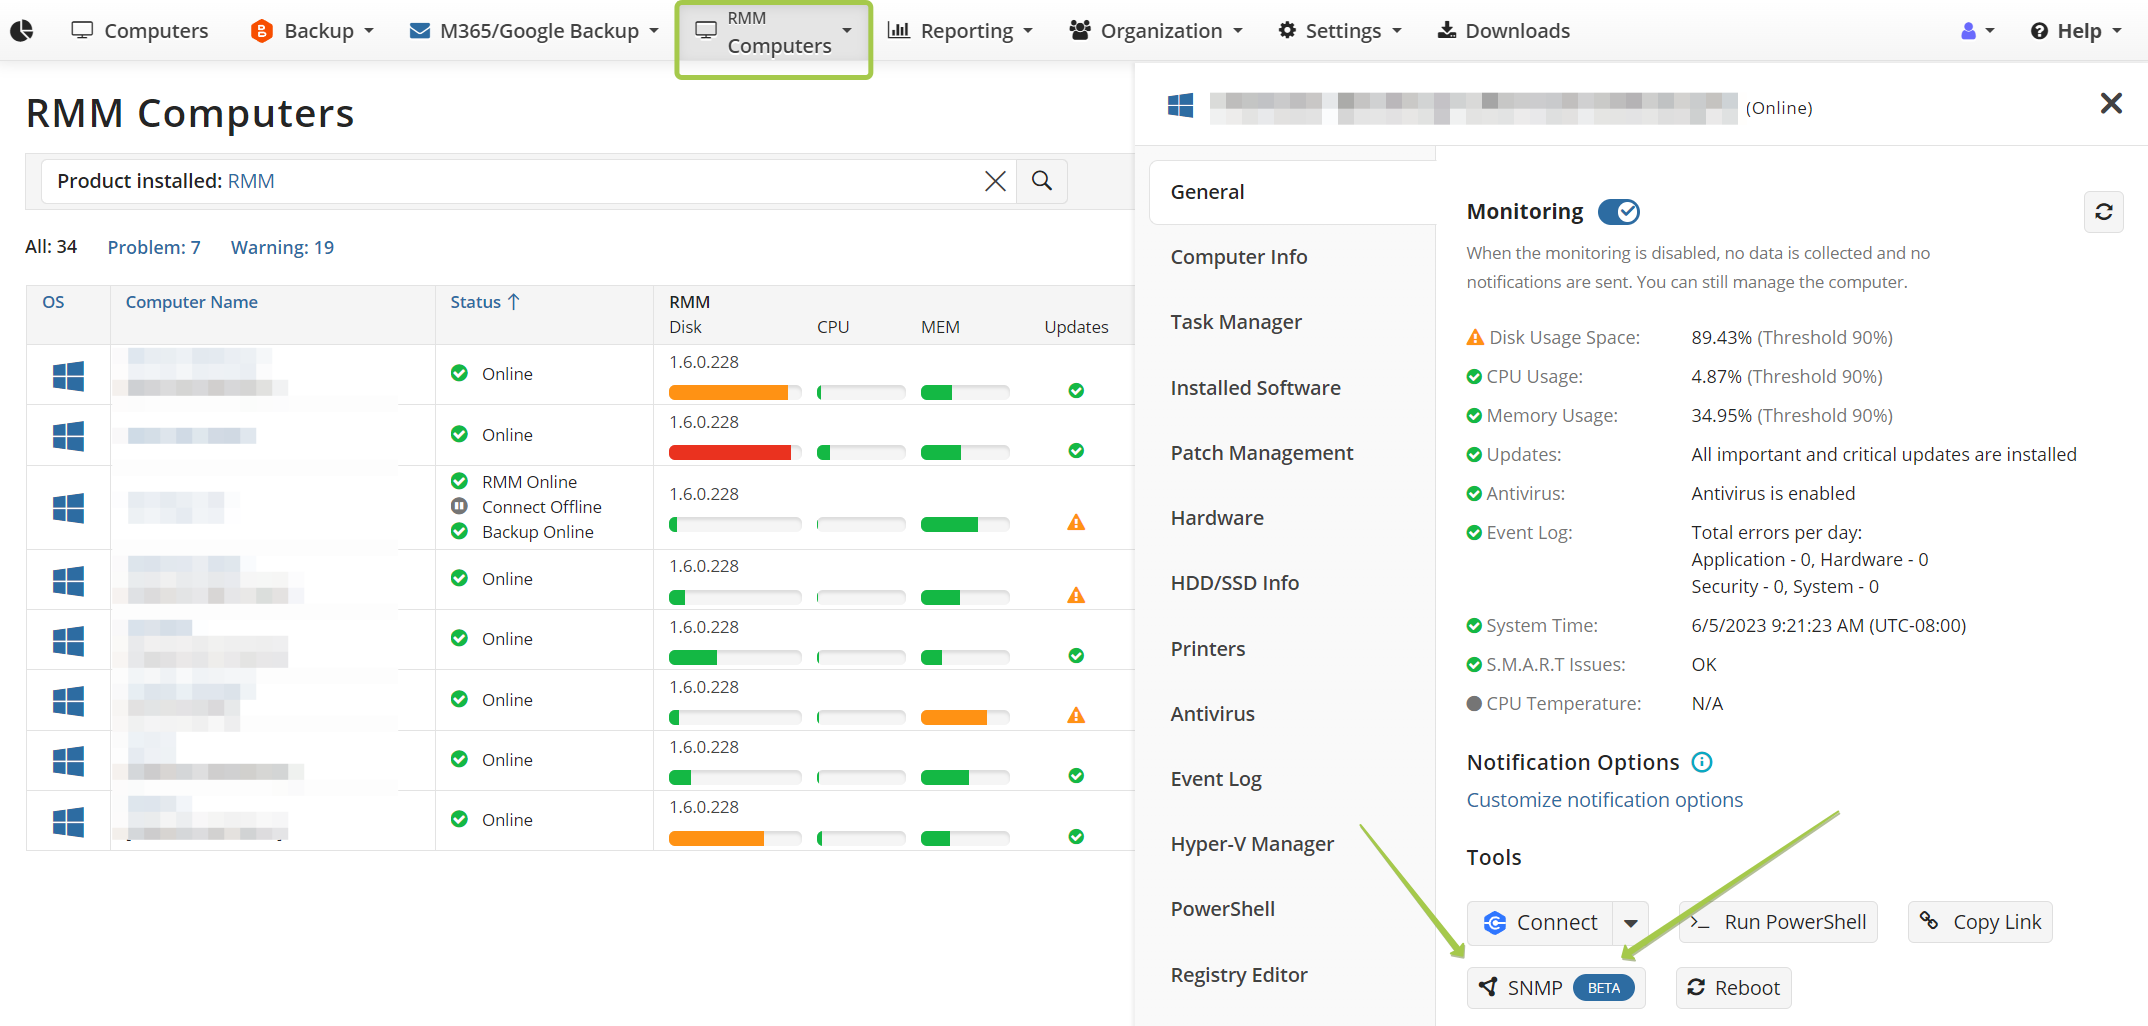
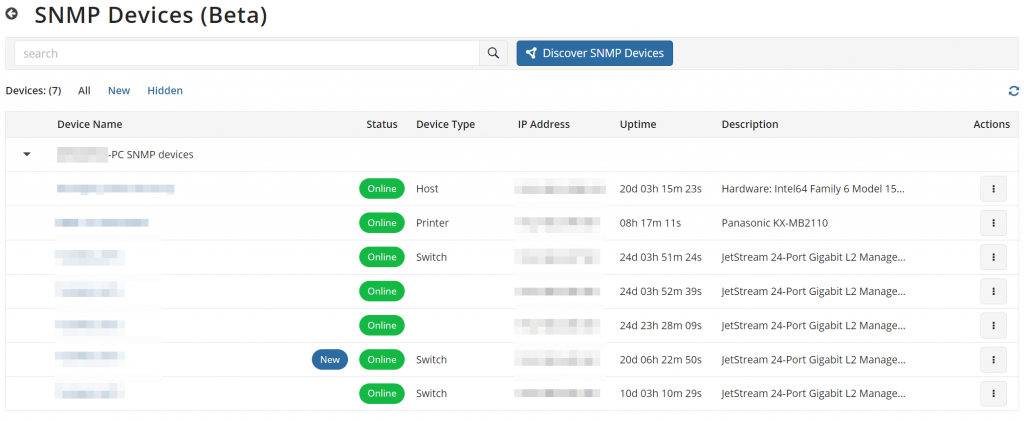
RMM allows you to monitor your network environment, which includes devices working on SNMP v1, SNMP v2, and SNMP v3 protocols. To initiate the SNMP discovery process, go to the Computers tab, RMM section, and click the SNMP button located on the sidebar that opens after clicking on the diagram icon next to the desired device.
Conclusion
Effective computer monitoring plays a key role in keeping businesses safe. By using monitoring and alerting features, you can identify and fix issues before they start threatening business processes.
If you have any questions regarding MSP360 RMM, feel free to contact our pre-sales team.
